
Accessible City Maps · For cities and municipalities

Know what to fix first.

An accessibility dashboard that turns residents’ reports into clear, data-backed priorities for the city.
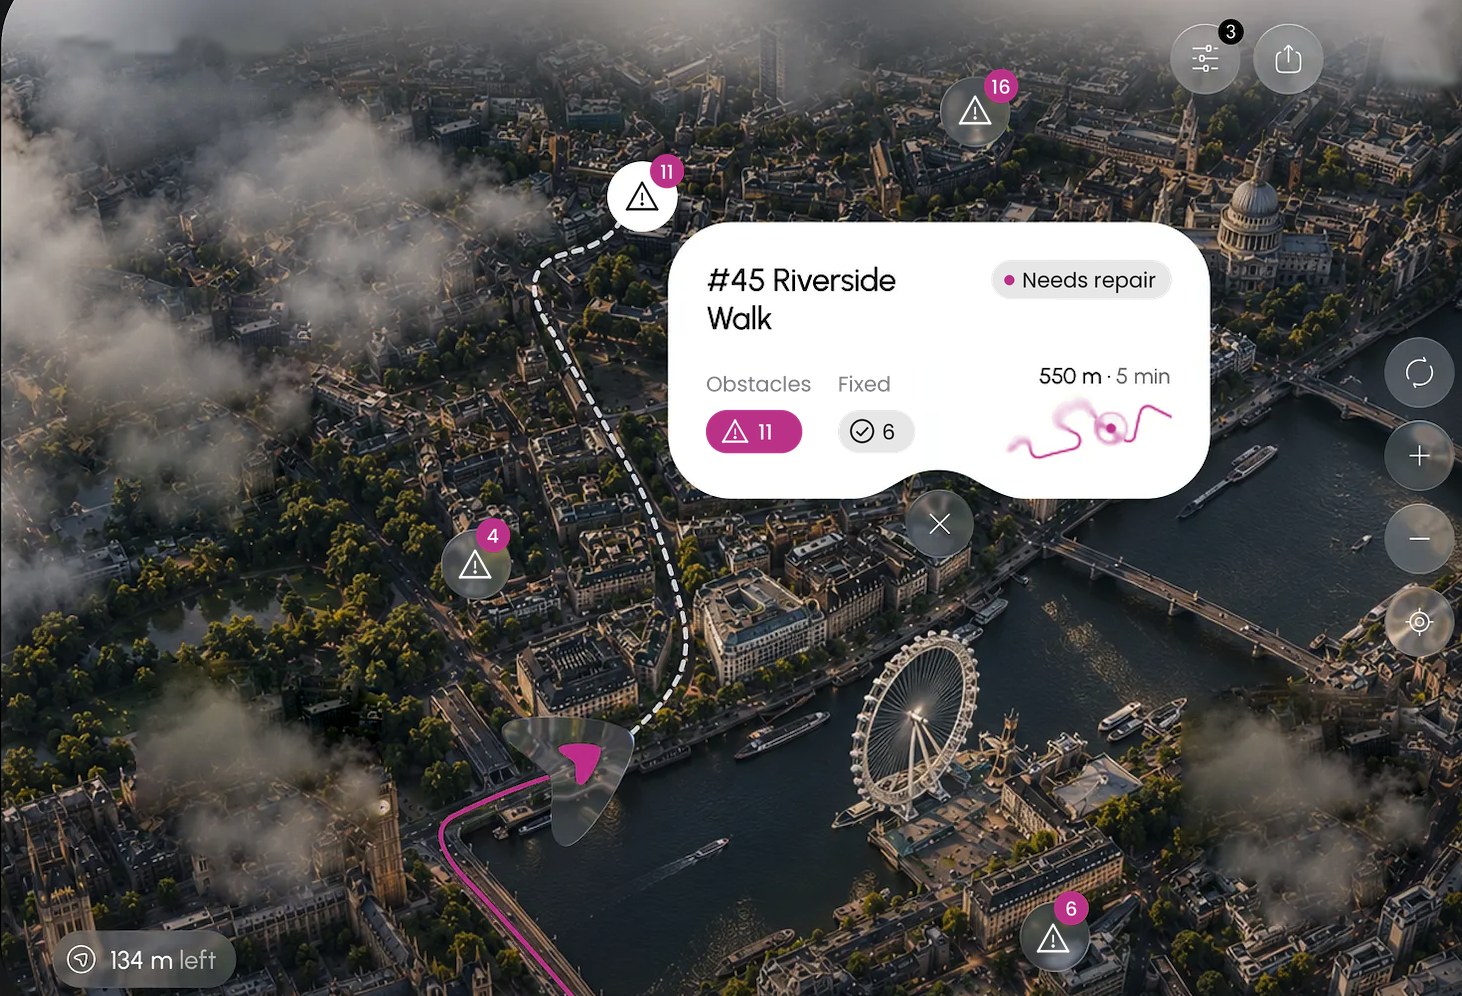
An aerial city map marking reported obstacles along a step-free route, with a card showing 11 obstacles and 6 fixed
What you get

One dashboard from report to repair.

City accessibility dashboard

A live map of obstacles such as missing ramps, broken kerbs, blocked pavements and inaccessible crossings.

Priority scoring

Ranks fixes by impact, using proximity to schools, hospitals, transit and public buildings, plus the number of reports.

Resident reporting

Residents and mappers log issues through the Accessify app, and you see them in the dashboard.

Fix tracking

Status from reported to scheduled to resolved, with before and after records.

Budget planning

Evidence for deciding where to spend limited capital funds.

Accessible tourism and local economy

A public accessibility map of venues and routes, plus verified data for the city’s tourism portal.

OPEN YOUR CITY

Evidence for funding, compliance and planning.

Funding and grant evidence

Audit-ready data for EU, national and donor applications.

Compliance and reporting

Accessibility reports for disability-rights commitments (UN CRPD) and SDG 11 reporting.

Open data and API

Feed accessibility data into journey planners and city apps.

Procurement support

Accessibility requirements and benchmarks for tenders.

Digital accessibility

For municipal websites and services, supporting public-sector web accessibility obligations.

Operational planning

Coordinate accessibility works with road, winter-maintenance and construction schedules.

Next step

Know what to fix first.

Start with a pilot district and see your priorities within weeks.

Request a city demo